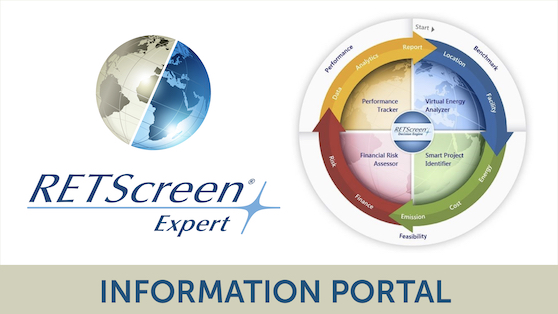
RETScreen Expert’s analysis capabilities cover an entire project life cycle
We’ve launched this Information Portal to introduce you to RETScreen—a “Made-in-Canada” software tool for low-carbon planning, implementation, monitoring and reporting
February 15, 2022 By Anthony Capkun
 Any RETScreen images, photos, screen captures, etc., in this Information Portal are used with permission of RETScreen.
 RETScreen Expert has analysis capabilities covering an entire project life cycle.
BENCHMARK ANALYSIS allows users to establish reference climate conditions at a facility site for any location on the planet, and compare the energy performance of various types of reference (benchmark) facilities with the estimated (modelled) or measured (actual) annual energy consumption of a facility.
Energy benchmarking allows designers, facility operators, managers and senior decision-makers to quickly gauge a facility’s energy performance i.e. expected energy consumption or production versus reference facilities, as well as scope for improvements.
FEASIBILITY ANALYSIS permits decision-makers to conduct a 5-step standard analysis: Energy, Cost, Emissions, Financial, and Sensitivity/Risk.
Fully integrated into this 5-step analysis are benchmark, product, project, hydrology and climate databases, as well as links to worldwide energy resource maps.
Also built-in is an extensive database of generic clean energy project templates, as well as specific case studies.
PERFORMANCE ANALYSIS allows a user to monitor, analyze, and report key energy performance data to facility operators, managers and senior decision-makers, including a facility’s actual energy performance versus predicted performance.
The Performance Analysis module integrates near real-time, satellite-derived weather data from NASA for the entire surface of the planet.
PORTFOLIO ANALYSIS allows a user to manage energy across a large number of facilities, spanning multiple energy efficiency measures in a multi-facility portfolio comprising thousands of buildings and power plants in multiple locations.
A user can also create a new portfolio or open an existing file. The “My Portfolio” database file is made up of individual facilities analyzed with RETScreen. Additional facilities can easily be added to the portfolio database. Sub-portfolios can be created to allow for comparison across different facility types and geographic regions, and a mapping tool helps the user visualize assets across the globe.
With a populated database, the user can enable a portfolio-wide analysis dashboard, which can be configured to include the results of Benchmark, Feasibility and Performance analysis for each individual facility in the portfolio. The dashboard allows the user to consolidate results to readily track energy consumption and/or production, as well as costs and greenhouse gas emissions, all of which can be sorted by facility type, fuel type, country, etc.
These results can then be used to report key metrics to various stakeholders.
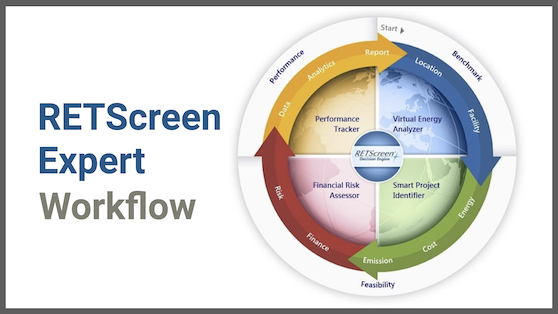
Inputs and Outputs
The RETScreen Expert workflow consists of a series of worksheets (tabs located at top of the software window) and accompanying databases. Generally, the user works from left to right, completing the Location worksheet first, followed by the Facility worksheet, etc.
On each worksheet, it is recommended that the user follows the steps outlined in the ribbon near the top of the software window, completing each worksheet from top to bottom.
The Energy Model worksheet is used to simulate the energy consumption and/or production of various types of facilities, including individual measures and systems. A fully integrated user manual facilitates data entry by the user.
From benchmarking to consumption tracking and GHG emissions, energy audits and more, RETScreen provides a solution for all facility and energy managers to take control of their portfolio.
Print this page